Datasets
Standard Dataset

Effect of acceptance and commitment therapy on rehabilitation patients with spinal cord injury
- Citation Author(s):
-
HuangGang

- Submitted by:
- Huang Gang
- Last updated:
- Wed, 12/11/2019 - 07:33
- DOI:
- 10.21227/68bq-y671
- Data Format:
- License:
 53 Views
- Categories:
- Keywords:
Abstract
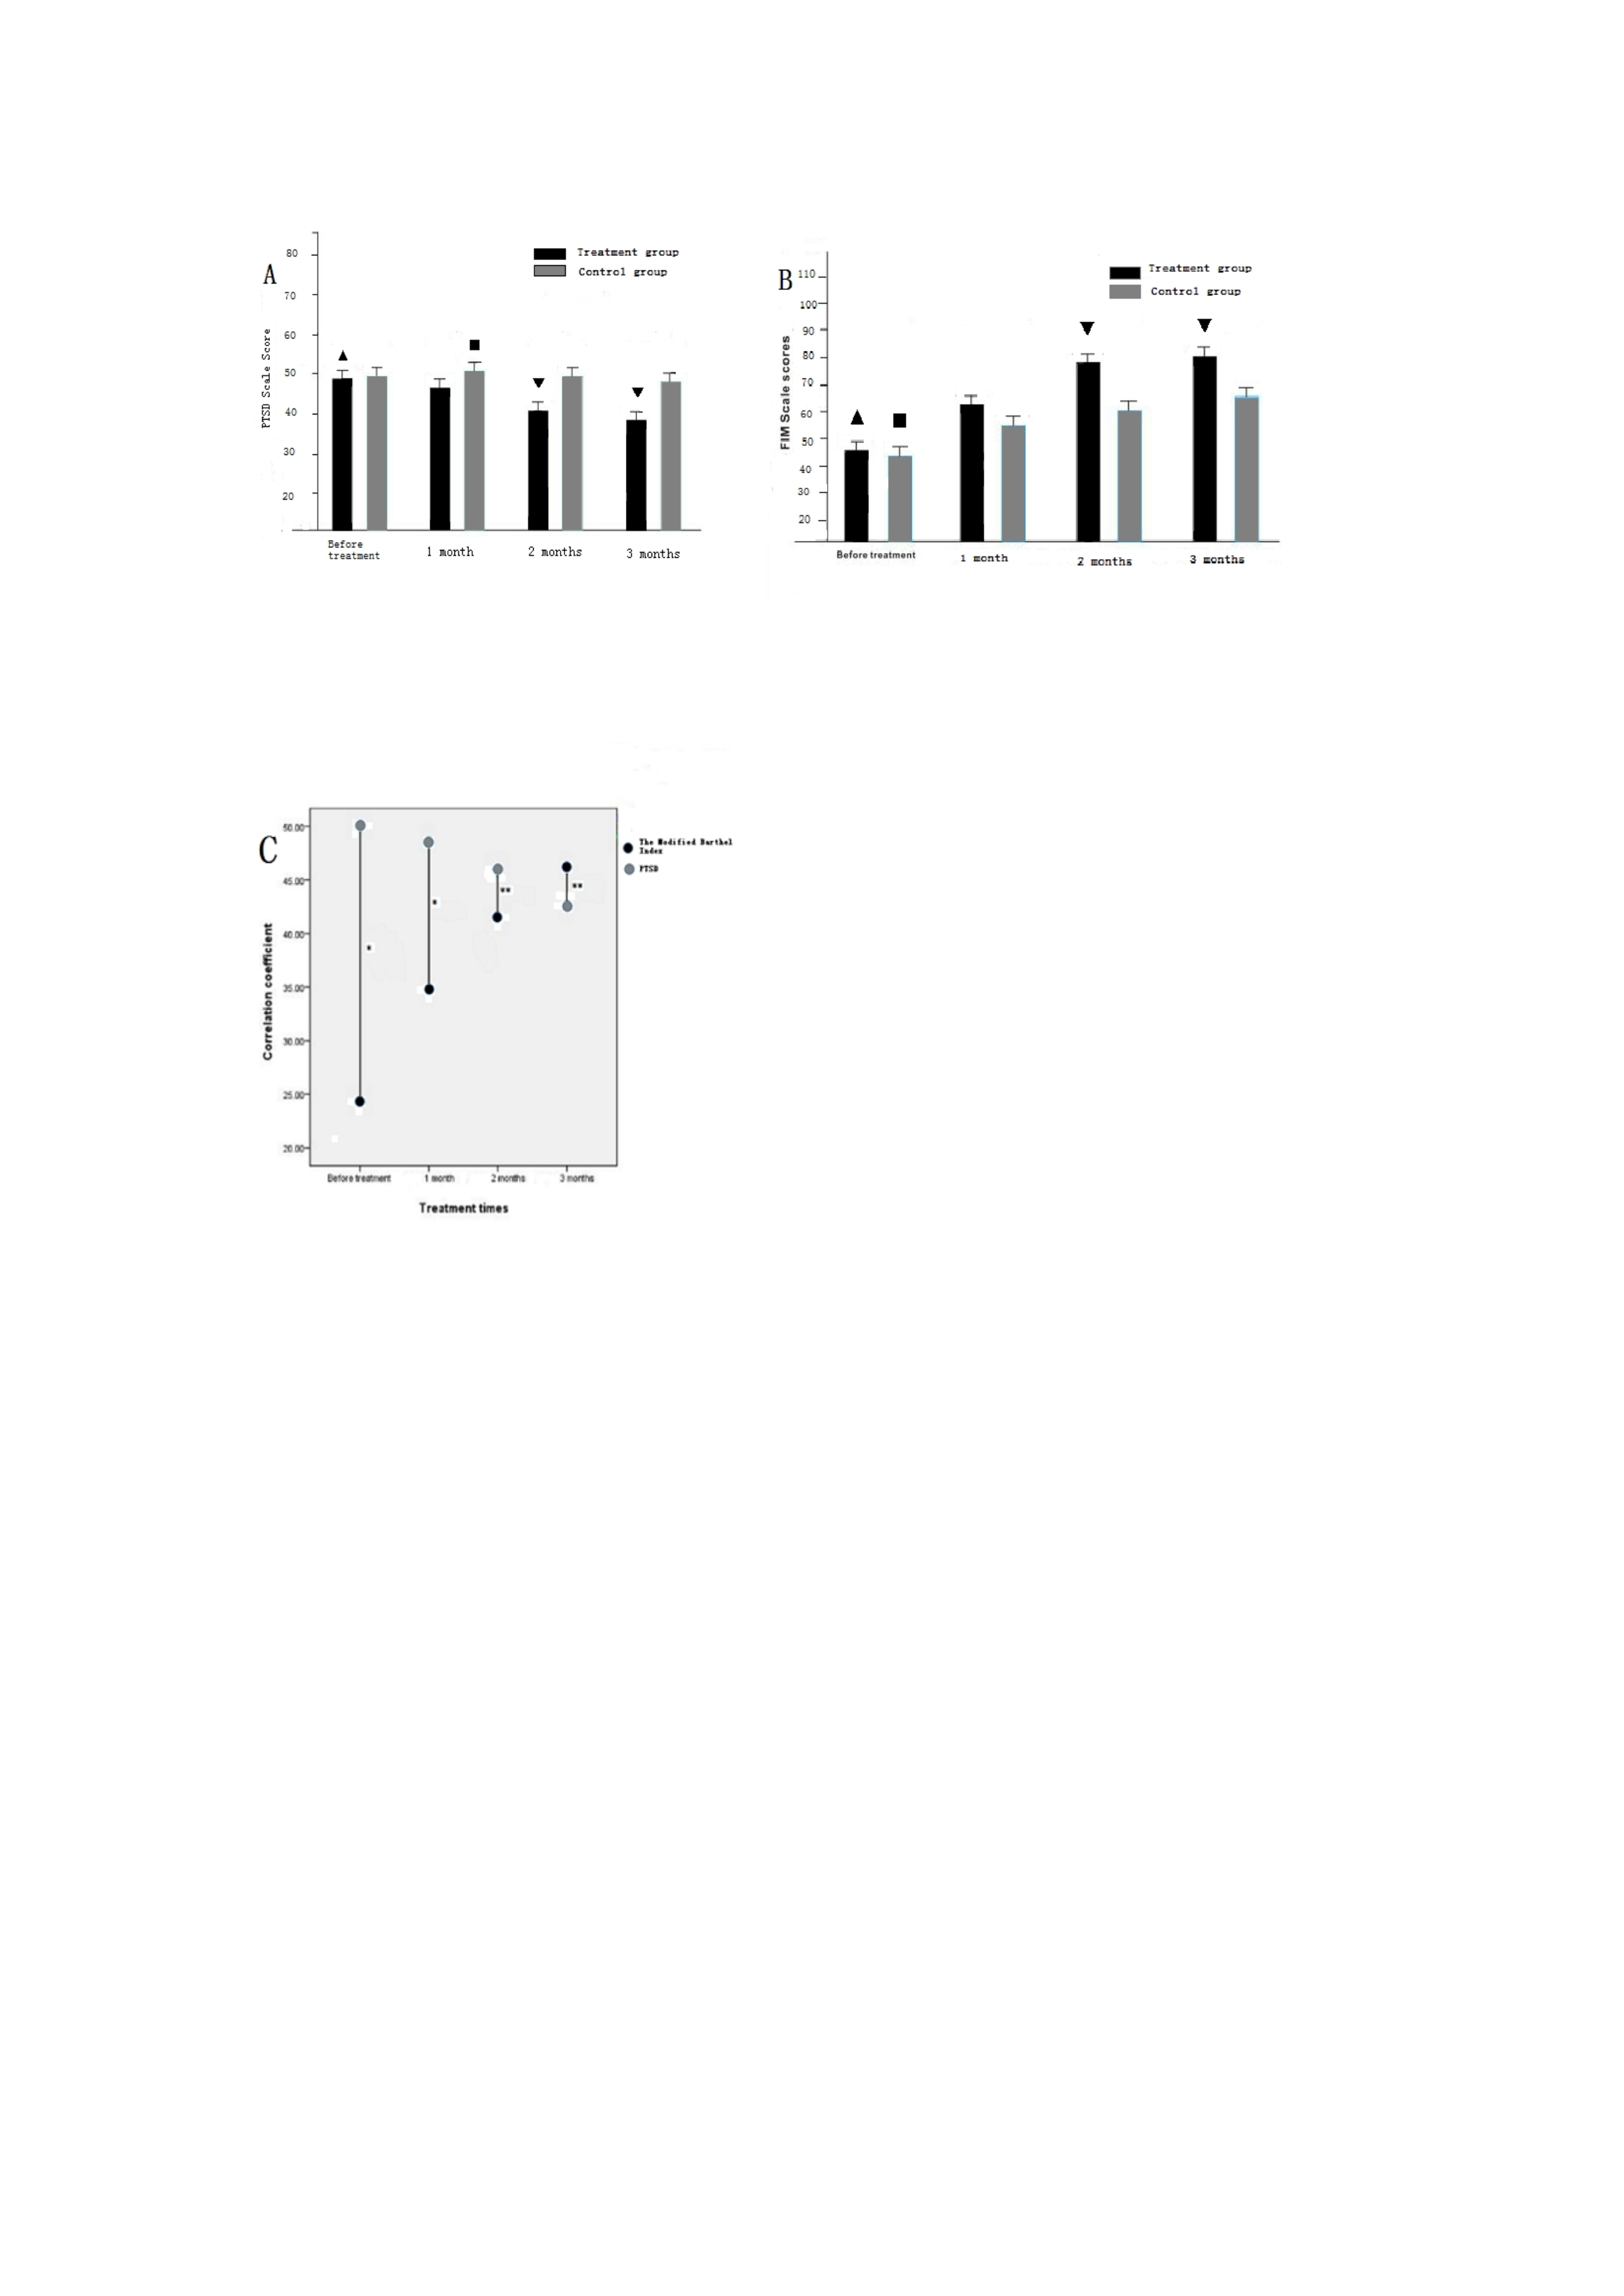
Figure A and B:
A:▲:Comparison of total PTSD scores of the treatment group within before and after 1, 2 and 3 months treatment(P<0.01).▼:Comparison of total PTSD scores between treatment group and control group(P<0.01).■:Look at the control group, there was no significant difference between before treatment and 1 month after treatment(P>0.05), but there was significant difference in the 2 months after treatment(P<0.05), and the difference was more significant in the 3 months after treatment(P<0.01).
B: ▲:Comparison of the total FIM scores of the treatment group before and after 1, 2 and 3 months treatment(P<0.01).▼:Comparison of total FIM scores between treatment group and control group(P<0.01).■:Comparison of total PTSD scores of the control group before and after treatment in 1, 2 and 3 months(P<0.01).
Data expressed as mean ± standard error (SEM)
Figure C
The modified Barthel Index according to FIM scale was correlated with the total score of PTSD, and the data was expressed as mean ± standard error (SEM) * P < 0.05, * * P < 0.01.
Comparison of total PTSD scores of two groups at each time point(Fig.A)
There was no significant difference in the total score of PTSD between the treatment group and the control group at admission [t = 0.273] and 1 month after treatment [t = 1.939],(P & gt; 0.05). There was significant difference between the two groups after 2 months [t = 3.248] and 3 months [t = 5.45],(P & lt; 0.01).(Table A).
In the treatment group, the total score of PTSD Scale decreased in a stepwise manner before and after treatment for 1 month [t = 11.87], 2 months [t = 11.96] and 3 months [t = 11.37], and there was significant difference between them (P & lt; 0.01).(Table B).
In the control group, there was no significant difference of the total score of PTSD between 1 month rehabilitation treatment and before treatment [t = -1.088],(P & gt; 0.05). There was significant difference between the two groups at 2 months after rehabilitation treatment[t = 2.226],(P & lt; 0.05), and 3 months after treatment witch it compared with 1 month treatment [t = 3.505],(P & lt; 0.01).(Table C).
Comparison of total FIM scores of two groups at each time point(Fig.B)
The total score of FIM in the treatment group (T) and the control group (C) increased in a stepwise manner in the end treatment of 1 month [TT = -10.78; TC = -5.009], 2 months [TT = -7.505; TC = -4.115], 3 months [TT = -7.187; TC = -6.727], and the difference was statistically significant(P & lt; 0.01). (Table D & E).
Compared with the total score of FIM between the treatment group and the control one, at the time of admission [t=-0.268] and one month after treatment [t = -1.248], although the treatment group had the tendency to improve, but there was no significant difference between them (P & gt; 0.05). After 2 months treatment[t = -2.523](P & lt; 0.05), and 3 months treatment [t = -2.876](P & lt; 0.01), the total score of FIM in the treatment group was higher than that in the control one, and there was significant difference between the two groups.(Table F)
Correlation between the improved Barthel index of FIM and the total score of PTSD about two groups (Fig. c).
There was significant negative correlation between the two groups before treatment [R = - 40.3], 1 month after treatment [R = - 33.6], 2 months after treatment [R = - 28.4], and 3 months after treatment [R = - 25.4].


