Datasets
Standard Dataset

Graphical Summaries
- Citation Author(s):
-
HuangGang

- Submitted by:
- Huang Gang
- Last updated:
- Wed, 12/04/2019 - 21:04
- DOI:
- 10.21227/cwfj-wp44
- License:
 51 Views
- Categories:
Abstract
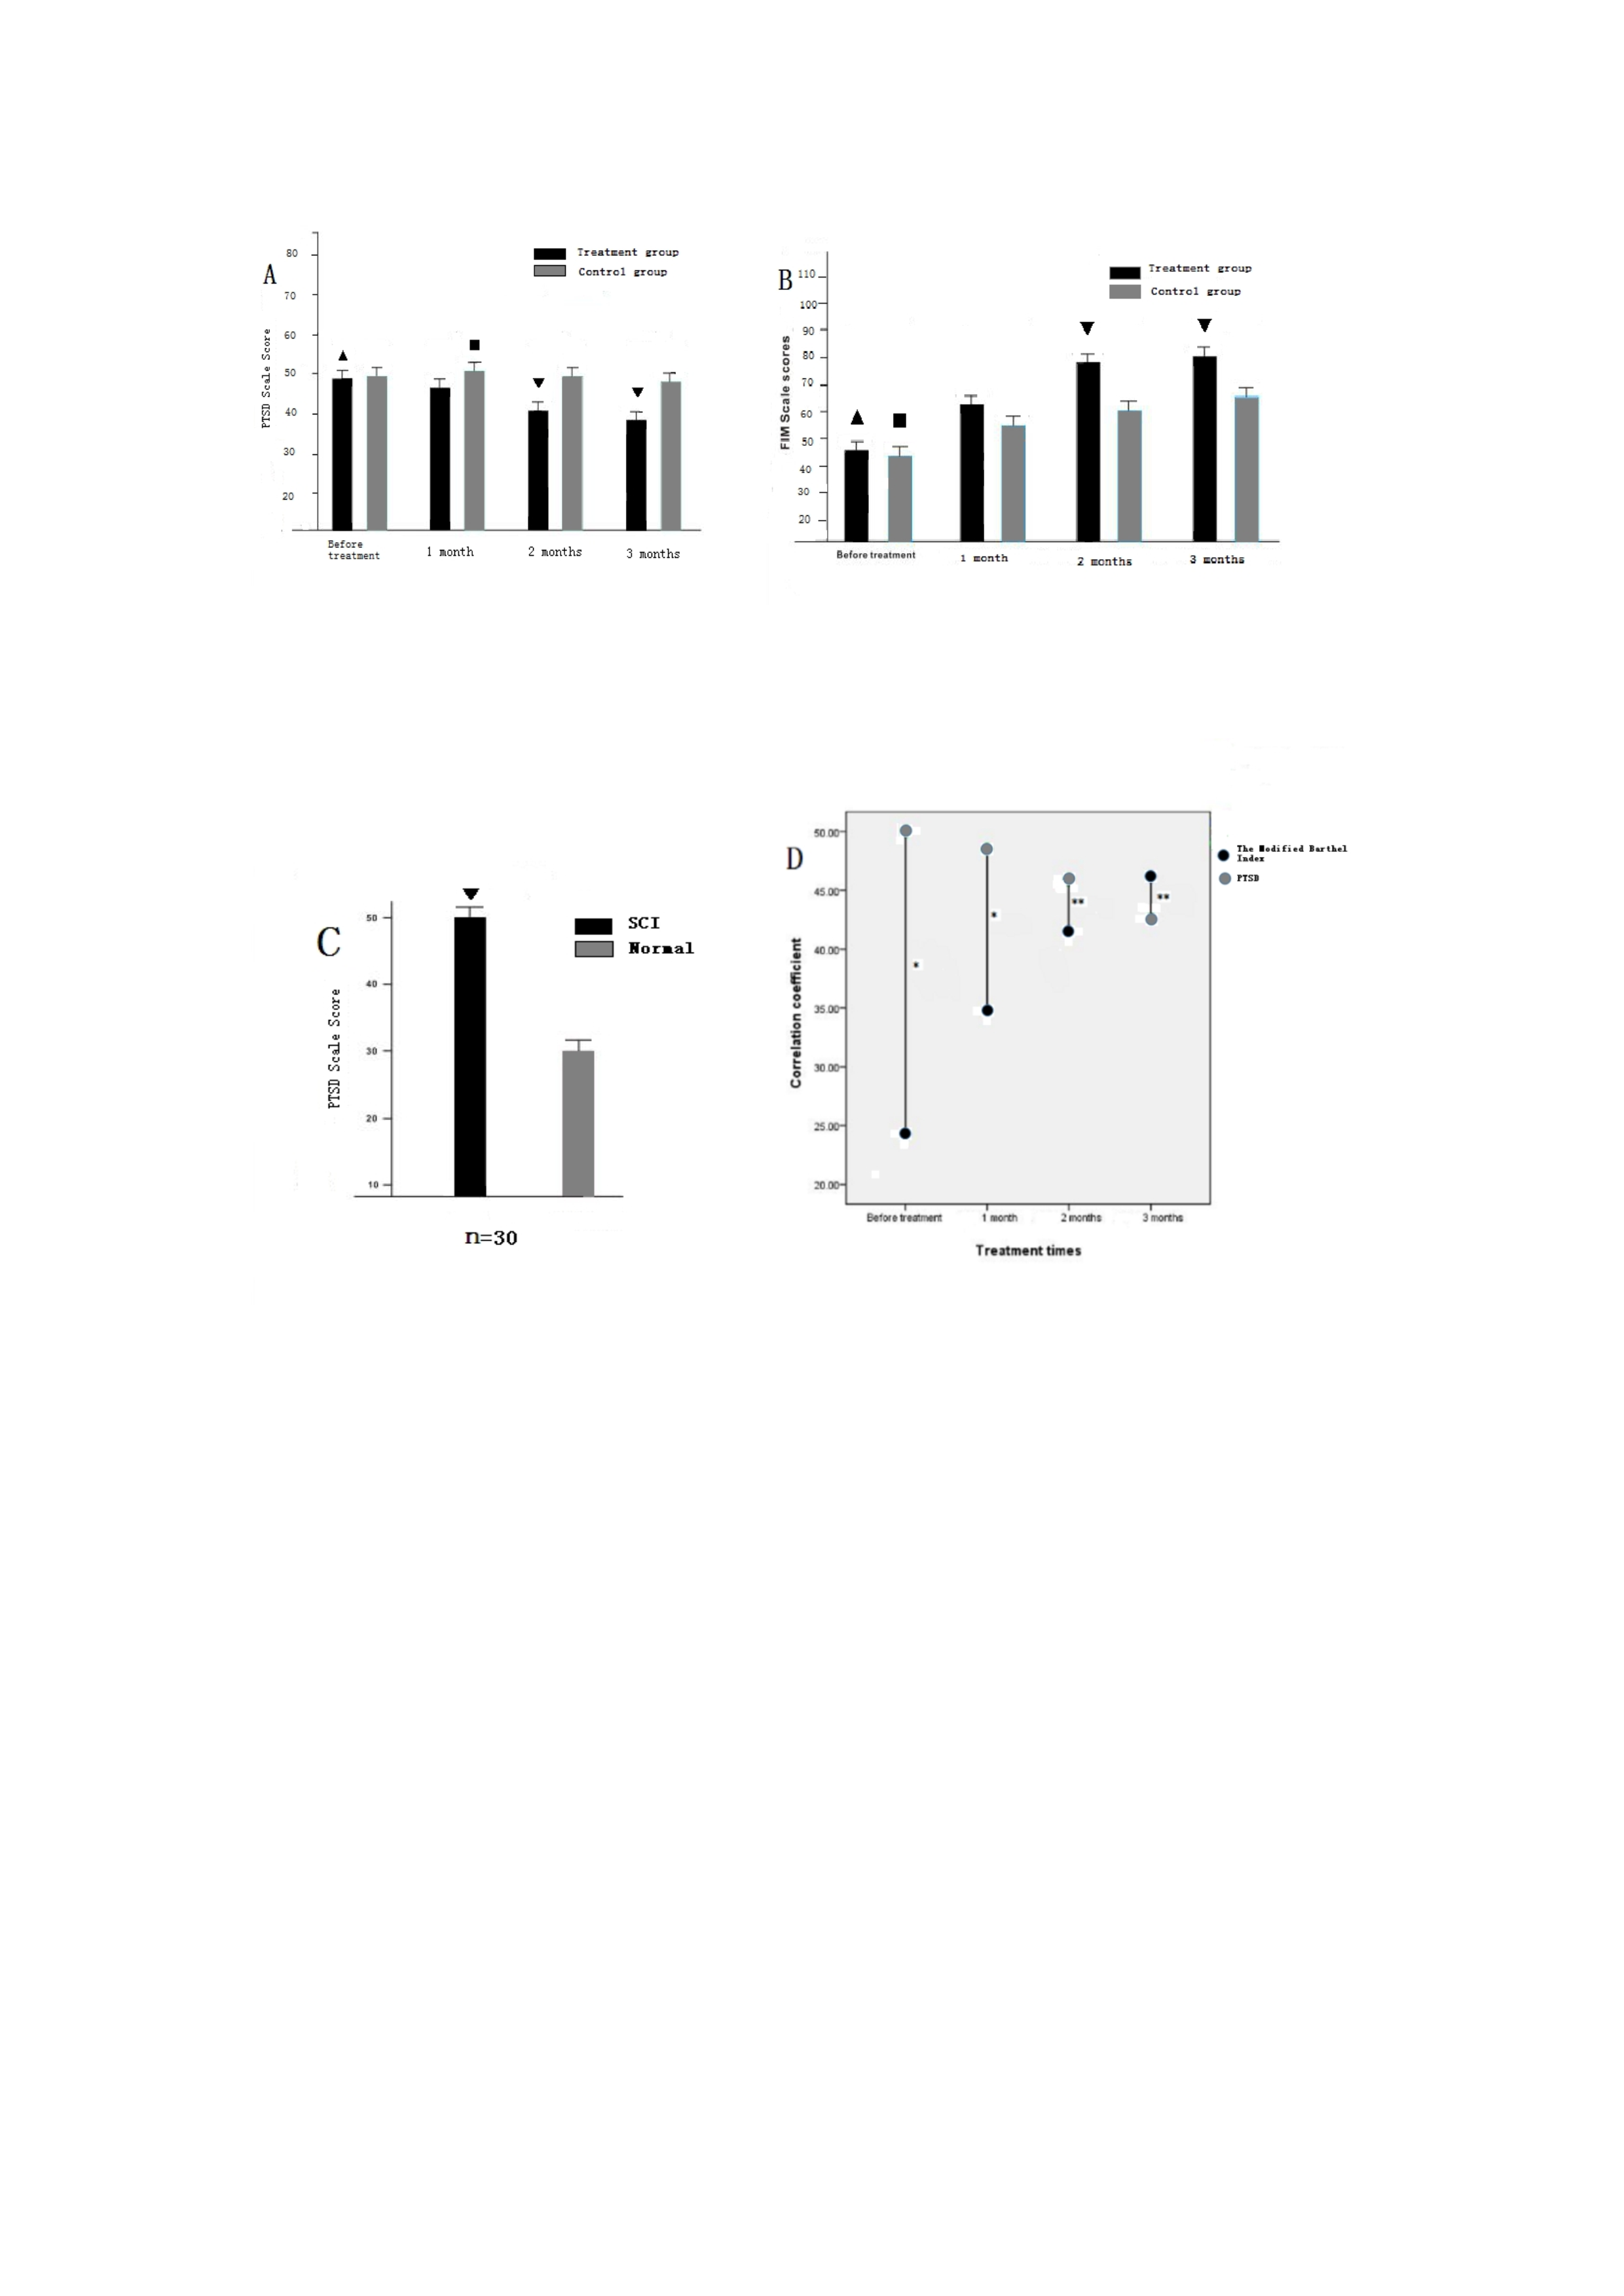
Figure A and B:
A:▲:Comparison of total PTSD scores of the treatment group within before and after 1, 2 and 3 months treatment(P<0.01).▼:Comparison of total PTSD scores between treatment group and control group(P<0.01).■:Look at the control group, there was no significant difference between before treatment and 1 month after treatment(P>0.05), but there was significant difference in the 2 months after treatment(P<0.05), and the difference was more significant in the 3 months after treatment(P<0.01).
B: ▲:Comparison of the total FIM scores of the treatment group before and after 1, 2 and 3 months treatment(P<0.01).▼:Comparison of total FIM scores between treatment group and control group(P<0.01).■:Comparison of total PTSD scores of the control group before and after treatment in 1, 2 and 3 months(P<0.01).
Data expressed as mean ± standard error (SEM)
Figure C
▼:Compared with the total score of PTSD Scale in the SCI patients group and the healthy control group (P< 0.01).
The data showed as mean ± standard error (SEM)
Figure D
The modified Barthel Index according to FIM scale was correlated with the total score of PTSD, and the data was expressed as mean ± standard error (SEM) * P < 0.05, * * P < 0.01.
Documentation
| Attachment | Size |
|---|---|
| 178.82 KB |


