Datasets
Standard Dataset

Protein Structure and Synthetic Multi-view Clustering Datasets
- Citation Author(s):
- Submitted by:
- Mario Garza
- Last updated:
- Fri, 11/11/2022 - 14:07
- DOI:
- 10.21227/sp55-pe68
- Data Format:
- Research Article Link:
- Links:
- License:
 192 Views
- Categories:
- Keywords:
Abstract
PROTEIN STRUCTURE AND SYNTHETIC MULTI-VIEW CLUSTERING DATASETS
Multi-View Clustering (MVC) datasets used in the following paper:
Evolutionary Multi-objective Clustering Over Multiple Conflicting Data Views. Authors: Mario Garza-Fabre, Julia Handl, and Adán José-García. IEEE TRANSACTIONS ON EVOLUTIONARY COMPUTATION. Accepted for publication, November 2022.
This entry contains all 420 datasets used in the paper, including:
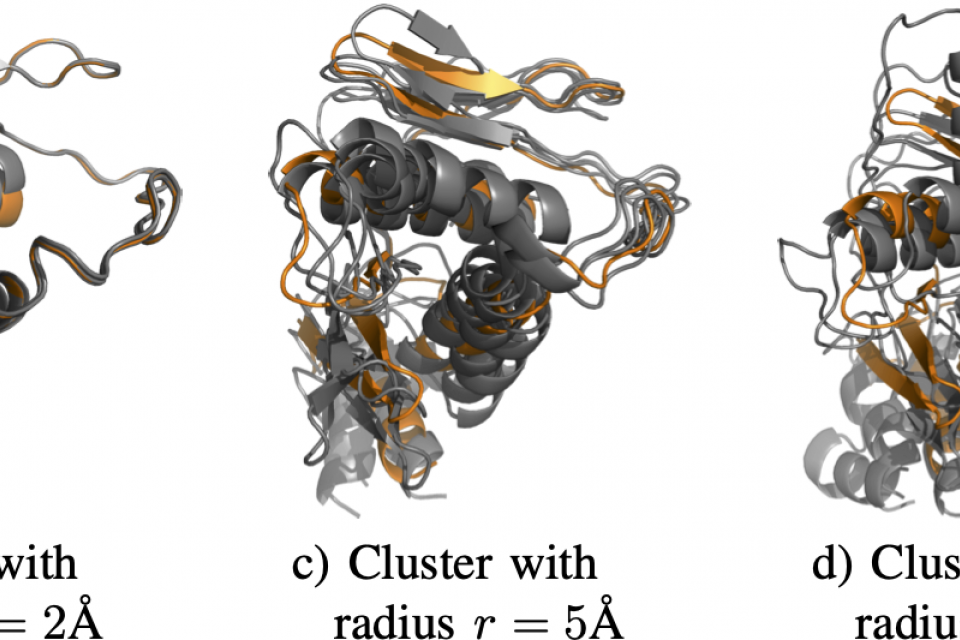
- 400 datasets of protein structures (Bioinformatics application). For these datasets, multiple dissimilarity matrices are provided, which can be exploited as data views during the clustering process. These matrices result from the use of distinct measures of structural similarity between the candidate structures. The process that we followed to construct these datasets is described in detail in our paper and its supplementary material.
- 20 synthetic, two-dimensional problems. These problems present varying characteristics regarding the shape, overlap, and separability of the clusters. Multiple views are defined by the use of two different distance measures: Euclidean Distance (data view 1) and Maximum Edge Distance (data view 2).
All data views (dissimilarity matrices) are provided as text files (*.txt), and additional files are included with detailed explanations regarding their organization and correct interpretation (README.txt, Problem_Information.csv, Problem_Information.xlsx).
Contact: Mario Garza-Fabre (mario.garza@cinvestav.mx; garzafabre@gmail.com)
*** Thanks in advance for properly citing our work if using these resources ***
PROTEIN STRUCTURE MULTI-VIEW CLUSTERING PROBLEMS - BIOINFORMATICS APPLICATION
A total of 400 multi-view datasets were used in our study. The files of these problems are organized into 197 directories; specific details are provided in:
- Problem_Information.xlsx
- Problem_Information.csv
The information provided for each of the 400 problems is as follows:
- Problem number: consecutive problem number, from 1 to 400.
- Protein target: protein identifier, from the Protein Data Bank (PDB).
- Number of clusters (K): total number of clusters in the dataset.
- Custer size: total number of samples in each cluster.
- Problem size (N): total number of samples (structures) in the dataset.
- Radius: specific radius used during problem generation (refer to the paper and its supplementary material for details).
- Data view 1: measure of structural similarity used as the first data view. Possible options are as follows:
- CMP: Hamming distance between contact maps
- GTS: global distance test - total score
- GHA: global distance test - high accuracy
- SSX: distance between extreme points of secondary structure elements
- TOR: distance in torsion (dihedral) angle space
- Data view 1 filename: path and filename of the NxN dissimilarity matrix corresponding to the first data view.
- Data view 2: measure of structural similarity used as the second data view. Possible options are the same as for the first view.
- Data view 2 filename: path and filename of the NxN dissimilarity matrix corresponding to the second data view.
- Labels filename: path and filename of the cluster assignment for the N samples; file contains N lines, each with a value from {0,1, ..., K-1}.
SYNTHETIC MULTI-VIEW CLUSTERING PROBLEMS
The 20 datasets are organized into separate directories:
- blobs2
- blobs3
- circles1
- circles2
- fourty
- long1
- long4
- longsquare
- moons3
- moons5
- sizes1
- sizes5
- smile1
- spiral
- spiralsquare
- square1
- square4
- triangle1
- triangle2
- twenty
Let N be the number of samples (problem size), D be the dimensionality (D=2 in all cases), and K the correct number of clusters. The following four files are included for each of the 20 datasets:
- data.txt: raw data, with N lines and D columns.
- labels.txt: correct cluster assignment for the N data samples; N lines, each with a value from {0,1,2, ..., K-1}.
- matrix_euclidean.txt: pre-computed NxN distance matrix, using the Euclidean distance (data view 1), as used our experiments.
- matrix_med.txt: pre-computed NxN distance matrix, using the MED distance (maximum edge distance, data view 2), as used in our experiments.


