Datasets
Standard Dataset

RSS Fingerprint Data
- Citation Author(s):
- Submitted by:
- Pai Chet Ng
- Last updated:
- Sat, 04/02/2022 - 01:27
- DOI:
- 10.21227/933k-0s17
- Data Format:
- License:
 384 Views
- Categories:
- Keywords:
Abstract
We consider a
large location with M number of grid points, each grid point is labeled with a unique fingerprint consisting of the received signal
strength (RSS) values measured from N number of Bluetooth Low Energy (BLE) beacons. Given the fingerprint observed by the
smartphone, the user’s current location can be estimated by finding the top-k similar fingerprints from the list of fingerprints registered
in the database.
RSS data for Fingerprint Localization
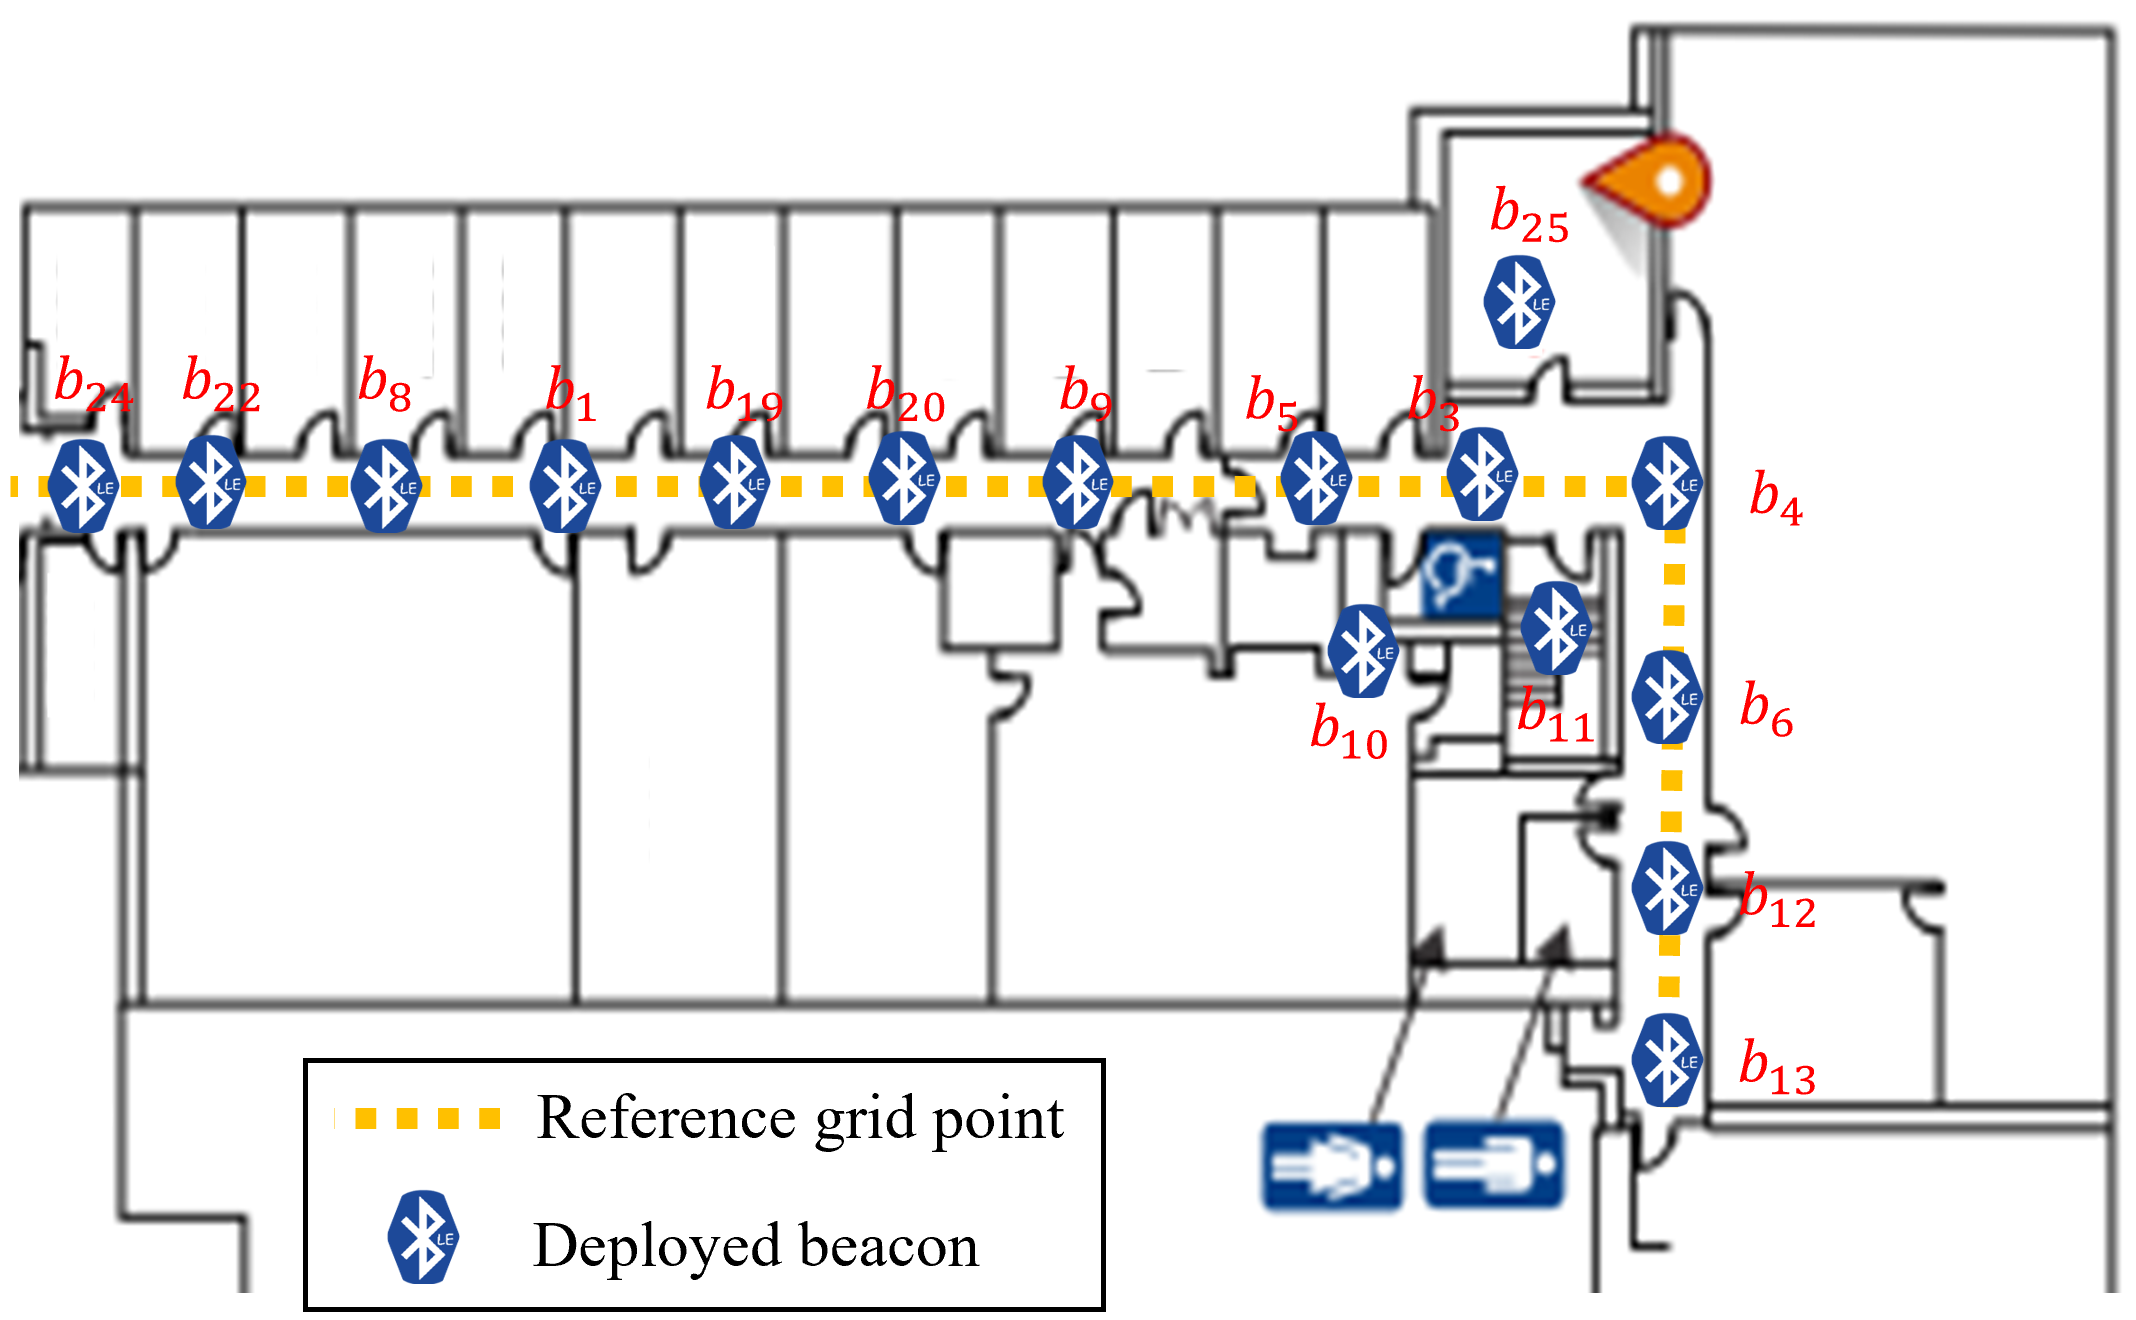
Received Signal Strength (RSS) is used to measure the signal strength at the receiver end. This project considers the RSS measured from the Bluetooth Low Energy (BLE) Beacons deployed in an indoor building. In total 15 beacons were deployed, the ID of these 15 beacons were {1,3,4,5,6,8,9,11,12,13,19,20,22,24,25}. The figure below shows the deployment floorplan in the Engineering Building, University of Guelph.
Data Collection
Two types of data were collected. First type of data was collected by placing the phone on the floor, whereas second type of data was collected by having the human subject holding the phone on their hand while following a certain path. Accordingly, the first type of data can be considered as the training data and is available in the training_data folder, and the second type of data can be considered as the testing data (simulating the real data collected from human subject holding a phone) and is available in the testing_data folder. The fingerprint map can be constructed using the training data. There are various methods to construct the fingerprint map, the sample-fingerprint folder consists a sample fingerprint map constructed with the averaging approach.
Training Data
The training_data folder consists of the raw data (in .csv format) collected at each grid point. Each grid point is labeled with its x and y coordinates. The file is named as "xxxyyy_raw.csv", where xxx denotes the x coordinate, and yyy denotes the y coordinate. For example, "000038_raw.csv" consists of the RSS data collected when the phone is located at x = 0, y = 38 (unit in cm). Each csv file is organized in 4 columns, the first column is just a dummy column which can be ignored, the second column denotes the RSS measurement in dBm, the third column indicates the time the RSS is measured by the smartphone, and the last column tells the source (i.e., the beacon) of the signal.
The data are consolidated using two protocols: [fingerprintRawData3] based on the scanning duration (typically 10s), and [fingerprintRawData2] based on the expected number of beacons (i.e., if the phone have seens the signals from all the expected beacons, it will stop the scanning immediately).
Testing Data
Similarly, the testing_data folder consists of the raw data at each grid point. The major difference here is that the data were collected when the phone was on the human hand. Please note that the human subject is asked to follow a certain path along the grid point, and the human subject did not have to stand at the exact same grid point as the one used to collect the training data. Furthermore, the human subjects were not restricted to any hand or body movement during the data collection, they can freely do anything (like what we will commonly do with the smartphone, e.g., texting, checking email) while having the phone to collect the data in the background. The purpose of doing this is to collect a more realistic data to simulate the real-world scenario where the human will use their phone for other context-aware interaction while having the phone to identify its location.


