Datasets
Open Access
Wireless Sensor Networks Dataset (TSCH a Compromise Between Reliability, Power Consumption, and Latency)

- Citation Author(s):
-
StefanoScanzio
 CNR-IEIITMohammadGhazi VakiliPolitecnico di TorinoGianlucaCenaCNR-IEIITClaudio GiovanniDemartiniPolitecnico di TorinoBartolomeoMontrucchioPolitecnico di TorinoAdrianoValenzanoCNR-IEIITClaudioZuninoCNR-IEIIT
 - Submitted by:
- Stefano Scanzio
- Last updated:
- Thu, 01/21/2021 - 06:00
- DOI:
- 10.21227/fg62-bp39
- Links:
- License:
 2909 Views
- Categories:
- Keywords:
Abstract
Performance of Wireless Sensor Networks (WSN) based on IEEE 802.15.4 and Time Slotted Channel Hopping (TSCH) has been shown to be mostly predictable in typical real-world operating conditions. This is especially true for performance indicators like reliability, power consumption, and latency. This article provides and describes a database (i.e., a set of data acquired with real devices deployed in a real environment) about measurements on OpenMote B devices, implementing the 6TiSCH protocol, made in different experimental configurations. A post-analysis Python script for calculating the above performance indicators from values stored in the database is additional provided. The results obtained by applying the script to the included database were published in [1], which contains more details than those reported in this short presentation of the dataset. Data and software are useful for two main reasons: on the one hand the dataset can be further processed to obtain new performance indices, so as to support, e.g., new ideas about possible protocol modifications; on the other hand, they constitute a simple yet effective example of measurement technique (based on the ping tool and on the accompanying script), which can be customized at will and reused to analyze the performance of other real TSCH installations.
Wireless Sensor Networks Dataset (TSCH a Compromise Between Reliability, Power Consumption, and Latency)
Abstract
Performance of Wireless Sensor Networks (WSN) based on IEEE 802.15.4 and Time Slotted Channel Hopping (TSCH) has been shown to be mostly predictable in typical real-world operating conditions. This is especially true for performance indicators like reliability, power consumption, and latency. This article provides and describes a database (i.e., a set of data acquired with real devices deployed in a real environment) about measurements on OpenMote B devices, implementing the 6TiSCH protocol, made in different experimental configurations. A post-analysis Python script for calculating the above performance indicators from values stored in the database is additional provided. The results obtained by applying the script to the included database were published in [1], which contains more details than those reported in this short presentation of the dataset. Data and software are useful for two main reasons: on the one hand the dataset can be further processed to obtain new performance indices, so as to support, e.g., new ideas about possible protocol modifications; on the other hand, they constitute a simple yet effective example of measurement technique (based on the ping tool and on the accompanying script), which can be customized at will and reused to analyze the performance of other real TSCH installations.
Introduction and Main Targets
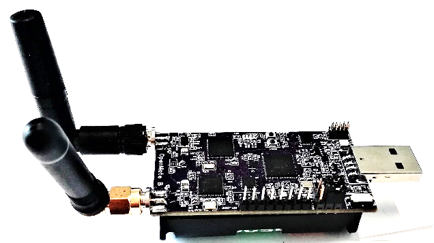
The data contained in this database/dataset were obtained from a real installation of OpenMote B devices communicating by means of 6TiSCH, in turn based on the Time Slotted Channel Hopping (TSCH) protocol. The network was composed of two motes, namely, a root mote and a leaf mote. The dataset was obtained by issuing a sequence of ping commands from the PC to which the root mote is connected to the leaf mote. The transmission pattern of ping packets is periodic with a period equal to 120 s.
A Python script (TSCHStats.py) is provided along with the database to calculate statistical indices related to reliability, power consumption, and latency. In particular, they were used to obtain the results reported in the following table, and in Table 6 that was published in [1].
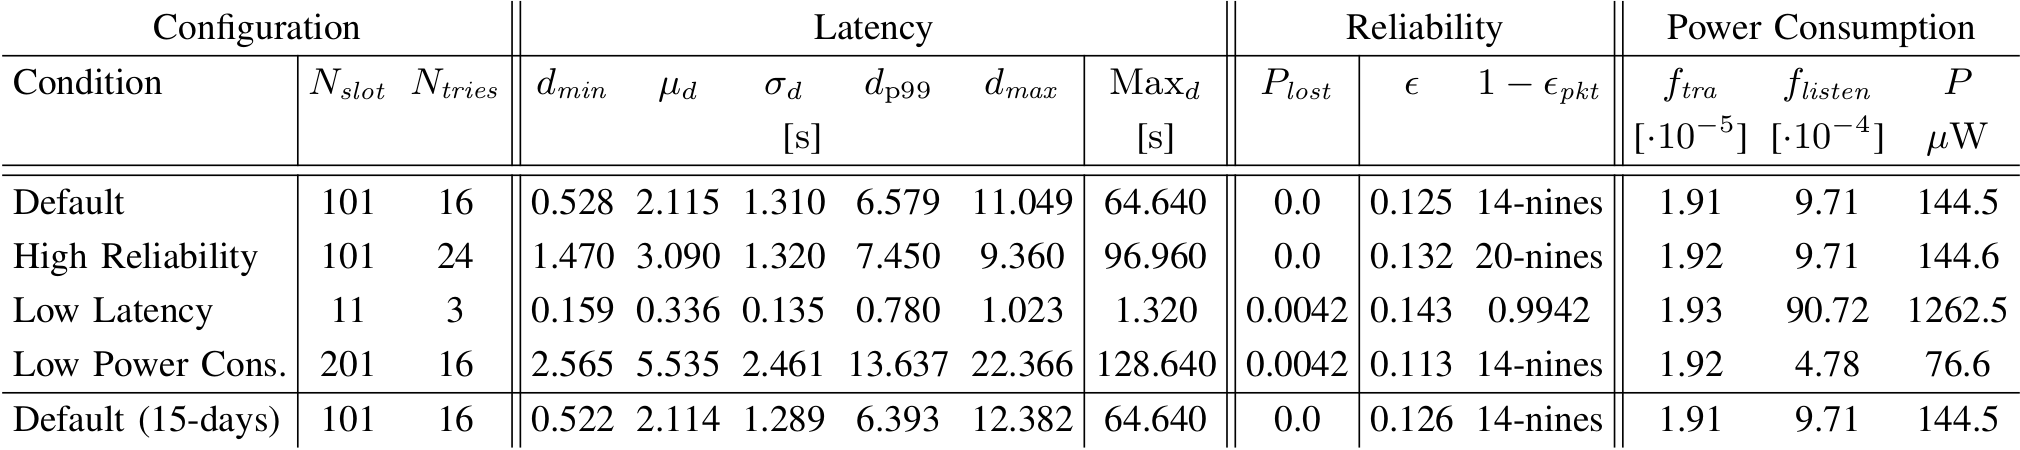
A number of relevant, typical experimental conditions were identified and analyzed, each one characterized by distinct values for protocol parameters N_slot (width of the slotframe, expressed as a number of slots) and N_tries (maximum number of allowed transmission attempts per data frame, the sender understands that the frame has not reached the destination if it does not receive the related ACK):
- Default: default configuration of the two parameters as per OpenWSN version
REL-1.24.0. - High Reliability: the likelihood that a frame is delivered to destination is improved by increasing
N_tries. - Low Latency transmission latency is decreased at the expense of reliability and power consumption, both of which suffer a worsening.
- Low Power Consumption: power consumption is decreased at the expense of latency, which increases.
In all experimental conditions an additional random interfering load, obtained by means of four Wi-Fi adapters, was injected on the wireless medium (details are reported in [1]).
For the first 4 experiments the duration was set to 1 day (i.e., 720 samples), while for the “Default (15-days)” condition the duration was 15 days (i.e., 10800 samples). The latter experiment also includes the samples of the “Default” (1 day) condition, which are reported at the beginning of the dataset.
The table (and the post-analysis script provided with the database) reports statistics related to:
- Latency: minimum latency, mean latency, standard deviation of latency, 99-percentile of latency, maximum latency, and theoretical worst-case latency, in this order.
- Reliability: packet loss ratio, frame error probability, and packet delivery probability, in this order.
- Power Consumption: rate of frame exchanges (including retries), rate at which idle listening occurs, power consumption, in this order.
Other details about statistical indices and how they can be modelled with a mathematical formulation can be found in [1].
The power consumption model employed in the script was obtained by means of measurements performed on real OpenMote B devices (details are reported in [1].
Main Targets
We decided to publish this database with two main targets in mind:
- Publicly provide the database about our measurement campaigns, from which new performance indices related to TSCH neworks can be evaluated (in addition to those reported in [1]). Having it available can be used as the starting point to identify weaknesses of the current protocol (for instance, when the database highlights long delays or severe losses) and develop new ideas for possible improvements.
- provide the post-analysis script and some notions about our experience on the measurement technique based on the
pingtool. Thepingcommand is a very simple means to inspect real TSCH installations from a quantitative point of view as well. In particular, the script can be used to analyze the behavior of the network in terms of three relevant performance indicators t (latency, reliability, and power consumption)
Database
Acquisition and experimental environment
The two OpenMote B devices used to acquire the experimental data were installed with the OpenWSN (version REL-1.24.0) operating system. Operating from the PC on which the root mote was connected, the following ping command was issued to repeatedly query the leaf mote (every 120 s):
ping6 -s 30 -i 120 -c 720 bbbb:0:0:0:12:4b00:18e0:ba23 where bbbb:0:0:0:12:4b00:18e0:ba23 represents the IPv6 address of the leaf mote, 30 is the message payload (in bytes), 120 is the period (in seconds), and 720 is the number of collected samples.
Experiments were performed by purposely injecting an additional interfering load to the usual background activity found on the wireless channel. This was obtained by means of 4 Wi-Fi interferers, which generate traffic on Wi-Fi channels 1, 5, 9, and 13, respectively. Details on the characteristic of this additional traffic pattern are given in Section V in [1].
Directory structure
The database has the following directory structure:
    TSCH_db
        |-- TSCHStats.py
        |-- default-101-16-24h_1.dat
        |-- high_reliability-101-24-24h.dat
        |-- low_latency-11-3-24h.dat
        |-- low_power_consumption-201-16-24h.dat
        |-- 101-16-15_days
            |-- default-101-16-24h_1.dat
            |-- default-101-16-24h_2.dat
            |-- …
            |-- default-101-16-24h_15.dat
            |-- default-101-16-15days.dat
In the main folder (i.e., TSCH_db), the file named TSCHStats.py contains the script used to perform the post analysis on the data files included in the database, which are characterized by the extension .dat. The files default-101-16-24h_1.dat, high_reliability-101-24-24h.dat, low_latency-11-3-24h.dat, and low_power_consumption-201-16-24h.dat represent the conditions Default, High Reliability, Low Latency, and Low Power Consumption, respectively. Each of them consists of 720 samples.
Inside the subdirectory named 101-16-15_days, the 15 files (from default-101-16-24h_1.dat to default-101-16-24h_15.dat) refer to 15 consecutive days during which the Default condition was analyzed. Each one of these files contains 720 samples. They were merged in a single file named default-101-16-15days.dat, which contains 10800 samples.
Every database (for instance the default-101-16-24h_1.dat file) is a text file, where samples are encoded as follows:
38 bytes from bbbb::12:4b00:18e0:b97c: icmp_seq=2 ttl=64 time=1365 ms
38 bytes from bbbb::12:4b00:18e0:b97c: icmp_seq=2 ttl=64 time=3381 ms (DUP!)
The second case (identified with the string “DUP!”) refers to a transmission which caused a duplicate. In particular, after the loss of an acknowledge frame (ACK), the sender node retransmits the data packet, as it is unaware that the frame was correctly delivered to destination. This is due to the fact that the current implementation of OpenWSN does not use the IEEE 802.15.4 MAC layer sequence numbers to discard duplicated frames at the MAC layer.
Data analysis
A Python script named TSCHStats.py was specifically included in the database folder to obtain the results reported in Table 6 in [1]. In some conditions, results obtained by the script are slightly different if compared with those of Table 6 in [1], because some rounding operations were performed.
The script needs to be invoked with the following input arguments:
python3 TSCHStats.py <ping_file> <N_slots> <N_tries> <T_app>
where <ping_file> is a database file (for instance the default-101-16-24h_1.dat file), <N_slots> is the number of slots in a slotframe (101 for default-101-16-24h_1.dat), <N_tries> is the maximum number of allowed transmission attempts per frame (16 for default-101-16-24h_1.dat), and <T_app> is the sending period of ping packets (120000 in all the proposed databases, which corresponds to 120 s). Consequently, to execute the script on default-101-16-24h_1.dat the following command has to be typed:
python3 TSCHStats.py default-101-16-24h_1.dat 101 16 120000
Application to other TSCH networks
Similar datasets can be acquired on 6TiSCH OpenMote B nodes (or other kinds of WSN devices implementing TSCH), in different experimental environments (e.g., by varying the position of motes, and hence the distance between them), using the very same ping command exploited to obtain the databases analyzed in this work (i.e., ping6 -s 30 -i 120 -c 720 bbbb:0:0:0:12:4b00:18e0:ba23). In this way, new datasets can be acquired in different operating conditions, for which the expected performance of the network can be analyzed using the TSCHStats.py script.
S. Scanzio et al., "Wireless Sensor Networks and TSCH: A Compromise Between Reliability, Power Consumption, and Latency," in IEEE Access, vol. 8, pp. 167042-167058, 2020, doi: 10.1109/ACCESS.2020.3022434.
Dataset Files
 TSCH_dataset.zip (dataset) TSCH_dataset.zip (175.52 kB)
Open Access dataset files are accessible to all logged in users. Don't have a login? Create a free IEEE account. IEEE Membership is not required.
Documentation
| Attachment | Size |
|---|---|
| 235.82 KB |


