Datasets
Standard Dataset

Nile Tilapia (Oreochromis Niloticus ) dataset for non-invasive fish biometrics with computer vision models
- Citation Author(s):
- Submitted by:
- Fernando Ramirez
- Last updated:
- Tue, 03/26/2024 - 13:18
- DOI:
- 10.21227/kq7f-4h27
- Data Format:
- License:
 196 Views
- Categories:
- Keywords:
Abstract
Dataset comprising 129 images of Tilapia:
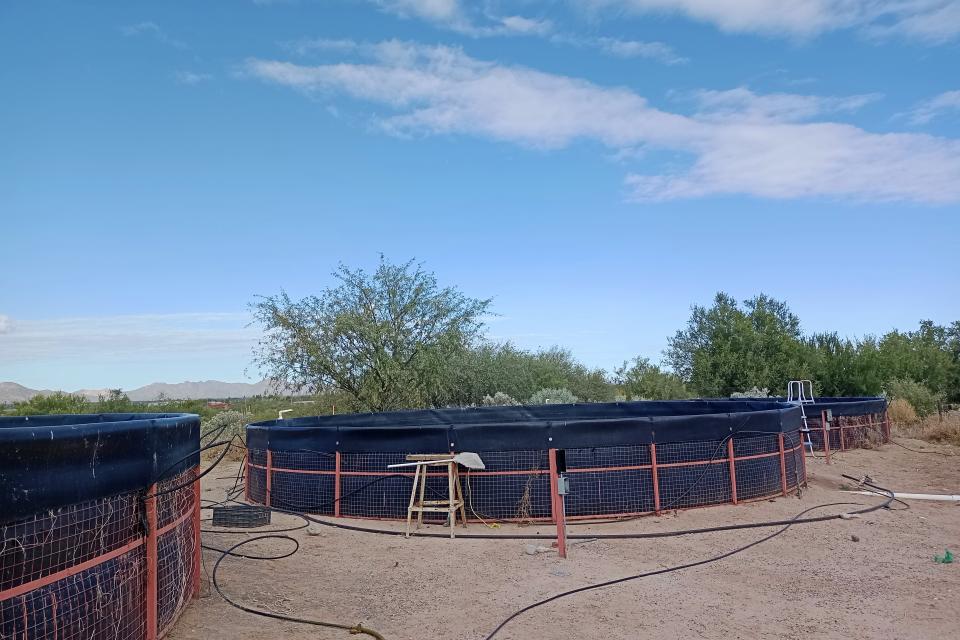
- 17 images of Nile Tilapia bred in a circular pond (diameter=10m, deep = 1.5m ) located at the tronconal in Hermosillo, Sonora, México and an aquarium in non-controlled light conditions.
- 112 imagesa of Nile Tilapia bred in tanks located at the Statal University of Sonora campus Navojoa taken in more controlled-light conditions.
Each fish was measured with a ruler; the longitude was measured from the beginning of tail to tip and the height was measured from the beginning of the dorsal fin to the bottom, and its weight was measured with a standard balance.
The images were taken with a logitech webcam c920 model
The zip contains a directory (folder) with the images of 129 Tilapia fish and a .csv file with the data of the 129 fish.
The first 17 images and data samples of the .csv file were taken in non-controlled ight conditions. The rest 112 images and data samples of the .csv file were taken in a more controlled light conditions setup.
The data encompasses:
- Tilapia number: the number of fish that corresponds with the number of image in de folder.
- Length (cm): the measured height from tail to tip.
- Height (cm): the height was measured from the beginning of the dorsal fin to the bottom.
- Weight (g): weight measured with a standard balance.
Machine learning algorithms can be applied to the data in the .csv as linear regression methods and power models to estimate biomass using a combination of paramaters.
Computer vision methodologies can be applied to the images to estimate parameters based on the data in the .csv file, which can be used as labels for the images.
A common model to test the data is the linear regression between Length and Weight (L-W relationship).
The results obtained by the regression or machine learning methods solely applied to the data of the .csv files can be compared against the computer vision methodologies applied to the images and .csv data.


