Datasets
Standard Dataset

Vehicle driving behavior
- Citation Author(s):
- Submitted by:
- Yong Zhang
- Last updated:
- Tue, 05/17/2022 - 22:17
- DOI:
- 10.21227/qzf7-sj04
- Data Format:
- Research Article Link:
- License:
 4387 Views
- Categories:
- Keywords:
Abstract
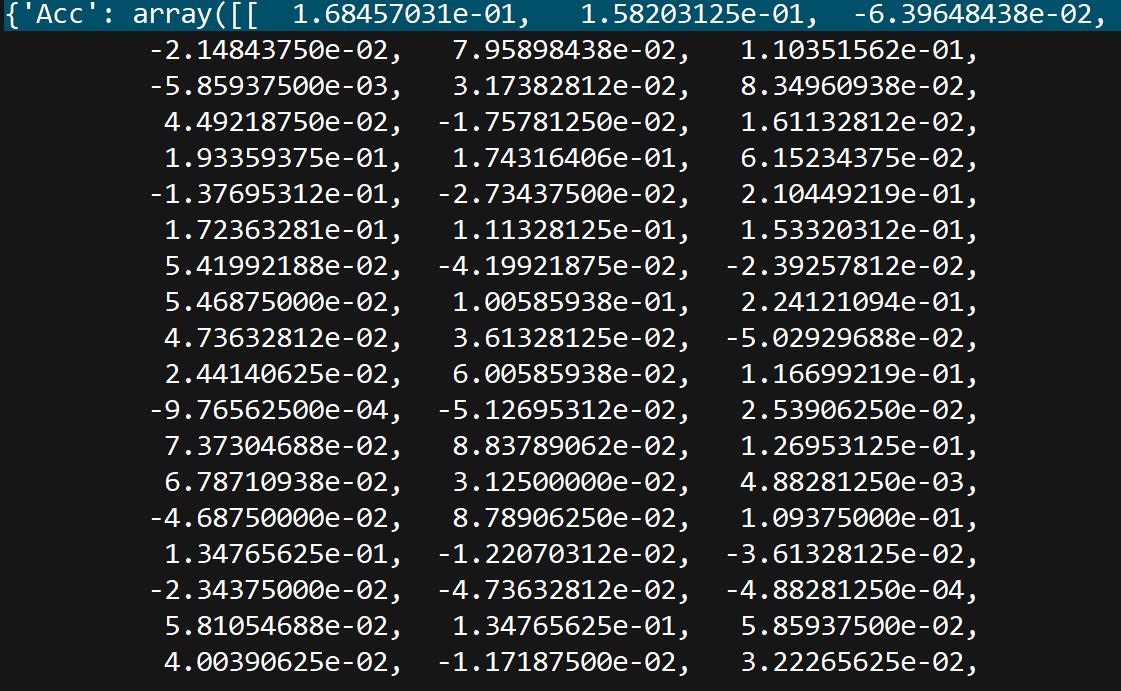
The data format is described as follows:
Event: {‘acc’: array([[x_axis], [y_axis], [z_axis], ‘gyr’,array([x_axis], [y_axis], [z_axis], ‘label’: No ]
No =1 means acceleration.
No =2 means normal driving.
No =3 means collision.
No =4 means left turn.
No =5 means right turn.
The dataset was analyzed and disclosed in the paper "Vehicle Driving Behavior Recognition Based on Multi-View Convolutional Neural Network (MV-CNN) with Joint Data Augmentation" for the first time.
We provide two .txt files, the raw dataset “RAW_DataSet.txt” and augmented dataset “Augmented_dataset.txt”.
The dataset was analyzed and disclosed in the paper "Vehicle Driving Behavior Recognition Based on Multi-View Convolutional Neural Network (MV-CNN) with Joint Data Augmentation" for the first time.
---------------------------------------------------------------------
The formal intruction is as follows:
We developed an experimental system to collect driving behavior data and evaluate our proposed method. The data acquisition module selects the six-axis sensor (MPU 6050) and uses a Wi-Fi module to transmit data in real-time. The integrated 3-axis accelerometer and 3-axis gyroscope accurately output the current attitude of the module in a dynamic environment.
The data acquisition equipment was equipped with the STM32 integrated with the MPU 6050 to realize real-time data collection by the motion processor. An SD card and Wi-Fi wireless transmission module were installed for storage and real-time data transmission, respectively.
The MPU 6050 chip was soldered onto the center of the vehicle with its front face facing upwards. The positive direction of the x-axis of the chip was the direction of the vehicle head. The positive direction of the y-axis was the direction of the left side of the vehicle, and the positive direction of the z-axis was perpendicular to the horizontal direction.
The collection device was mounted onto the remote control car, which was then powered on. Data were collected continuously and sent to the receiver server through the Wi-Fi module at a frequency of 10 Hz. Concurrently, we recorded the log information of various actions, including the current action tag, start timestamp, and end timestamp, during the collection process. The data acquisition was carried out during the acceleration, collision, left turn, right turn and normal driving of the vehicle. Each action was stored in a hexadecimal data file, which also included the specific action label and timestamp of the sample.
Finally, a total of 1,032 events were collected, of which 146, 224, 196, 200 and 266, were acceleration, collision, left turn, right turn and normal driving events. We use the Lagrange’s interpolation to resize each event to 300 samples. The collected raw data contained the accelerometer and gyroscope values of the x-axis, y-axis, and z-axis, respectively.
The 2,500 augmented samples are generated from the 1,032 original samples using MAWF. After the BNF algorithm was applied, the 2,500 samples were expanded to 5,000. Subsequently, the RC algorithm was used to expand the 5,000 samples to 10,000 samples. The original unbalanced data were converted into a balanced dataset, where the number of each event sample was equal. Finally we obtained 10,000 samples for our experiments.
The data format is described as follows:
Event: {‘acc’: array([[x_axis], [y_axis], [z_axis], ‘gyr’,array([x_axis], [y_axis], [z_axis], ‘label’: No ]
No =1 means acceleration.
No =2 means normal driving.
No =3 means collision.
No =4 means left turn.
No =5 means right turn.
Yong Zhang
Aug. 30, 2018
Dataset Files
- The original dataset RAW_DataSet.zip (2.37 MB)
- The augmented dataset Augmented_dataset.zip (110.04 MB)
Documentation
| Attachment | Size |
|---|---|
| 30 KB |


Comments
hi
I have a question. Is your augmented dataset have the same frequency with your raw dataset?