sensors

Most machine learning (ML) proposals in the Internet of Things (IoT) space are designed and evaluated on pre-processed datasets, where the data acquisition and cleaning steps are often considered a black box. Therefore, the data acquisition stage requires additional data cleaning/anomaly techniques, which translate to additional resources, energy, and storage.
- Categories:
 1110 Views
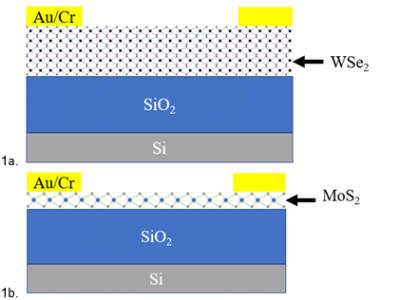
Two-dimensional (2D) materials have layered structure with unique properties. One of the properties of interest is the temperature coefficient of resistance (TCR) which should be large for fast thermal sensors. The TCR is the calculation of the relative change in resistance per degree of temperature change. Taking a step further, tunable TCR is a concept that involves the control of TCR by the gate voltage. Here we have shown that in a field effect transistor device, the 2D semiconductor material WSe2 has a TCR, which can be controlled by varying the applied gate voltage.
- Categories:
137 Views
<p>The proliferation of efficient edge computing has enabled a paradigm shift of how we monitor and interpret urban air quality. Coupled with the dense spatiotemporal resolution realized from large-scale wireless sensor networks, we can achieve highly accurate realtime local inference of airborne pollutants. In this paper, we introduce a novel Deep Neural Network architecture targeted at latent time-series regression tasks from continuous, exogenous sensor measurements, based on the Transformer encoder scheme and designed for deployment on low-cost power-efficient edge processors.
- Categories:
1044 Views
We have prepared a synthetic dataset to detect and add new devices in DynO-IoT ontology. This dataset consists of 1250 samples and has 35 features, such as feature-of-interest, device, sensor, sensor output, deployment, accuracy, unit, observation, actuator, actuation, actuating range, tag, reader, writer, etc.
- Categories:
325 Views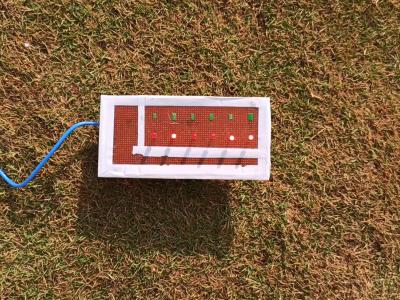
The LEDNet dataset consists of image data of a field area that are captured from a mobile phone camera.
Images in the dataset contain the information of an area where a PCB board is placed, containing 6 LEDs. Each state of the LEDs on the PCB board represents a binary number, with the ON state corresponding to binary 1 and the OFF state corresponding to binary 0. All the LEDs placed in sequence represent a binary sequence or encoding of an analog value.
- Categories:
551 Views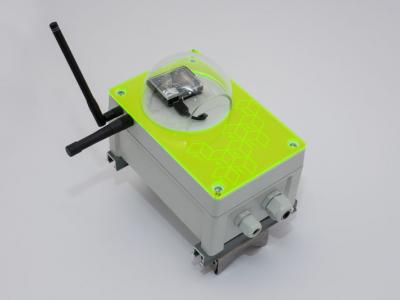
The Here East Digital Twin was a six month trial of a real-time 3D data visualisation platform, designed for the purpose of supporting operational management in the built environment.
- Categories:
715 Views
Academic spaces are an environment that promotes student performance not only because of the quality of its equipment, but also because of its ambient comfort conditions, which can be controlled by means of actuators that receive data from sensors. Something similar can be said about other environments, such as home, business, or industry environment. However, sensor devices can cause faults or inaccurate readings in a timely manner, affecting control mechanisms. The mutual relationship between ambient variables can be a source of knowledge to predict a variable in case a sensor fails.
- Categories:
473 Views
The dataset contains information about roses cultivation in greenhouses. It is aimed at identifying corrective actions to improve the roses state. Data acquisition was done with an autonomous robot incorporating sensors such as: soil humidity, light, temperature and humidity, and CO2.
- Categories:
1603 Views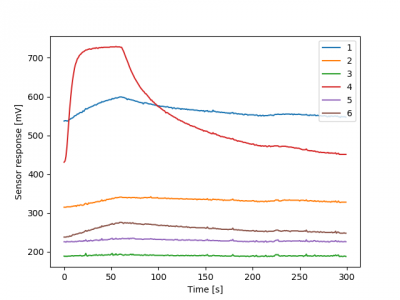
This dataset contains the resuts of an experiment in which an electronic nose implemented with six MOX sensors acquired samples of explosives in raw and combined states.
As for the collection of samples, a random experimentation was carried out in order to avoid that data generates any memory effect that could influence the results. Raw TNT and gunpowder data were taken in amounts of 0.1g to 2g. Soap and toothpaste were also used to be mixed with the explosives. In the end, we took samples of the explosive substances in raw and combined states.
- Categories:
752 Views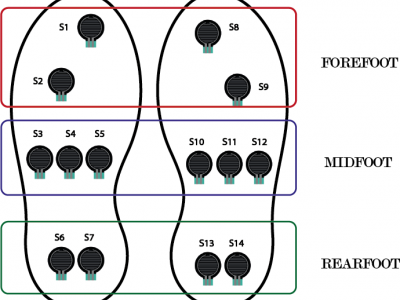
The pressure sensors are represented by black circles, which are located in the three zones of each foot. For the left foot: S1 and S2 cover the forefoot area. S3, S4, and S5 the midfoot area. S6 and S7 the rearfoot or heel area. Similarly, for the right foot: S8 and S9 represent the forefoot area. S10, S11, S12 the midfoot area. S13 and S14 the heel area. The values of each sensor are read by the analog inputs of an Arduino mega 2560.
- Categories:
992 Views